
.jpg)
BE THE FIRST TO GET PRODUCT UPDATES
Get notified about new features & special offers......
Jack Inman, BSc MS is the first team strength and conditioning coach at Bolton Wanderers Football Club. He has previously worked at other top football clubs within the UK and also in India.
Holding a Sports Science degree and Masters in Strength and Conditioning, Jack’s coaching is grounded in adaptation-led programming and tailored athlete development. His current focus combines speed, movement, strength, and rehab-based power training, underpinned by reflective practice and personal well‑being.
Working with a squad of 25+ players, in a 50+ game football season, creating an environment to manage fatigue and optimize physical performance is key, whilst keeping athletes engaged and tapping into their competitive nature. I've integrated output sports technology into my weight room sessions due to its reliability and ease of use. Whether that's for longitudinal tracking of lifts, autoregulation of volume, or gamifying sessions, Output has been a great addition to the programme.
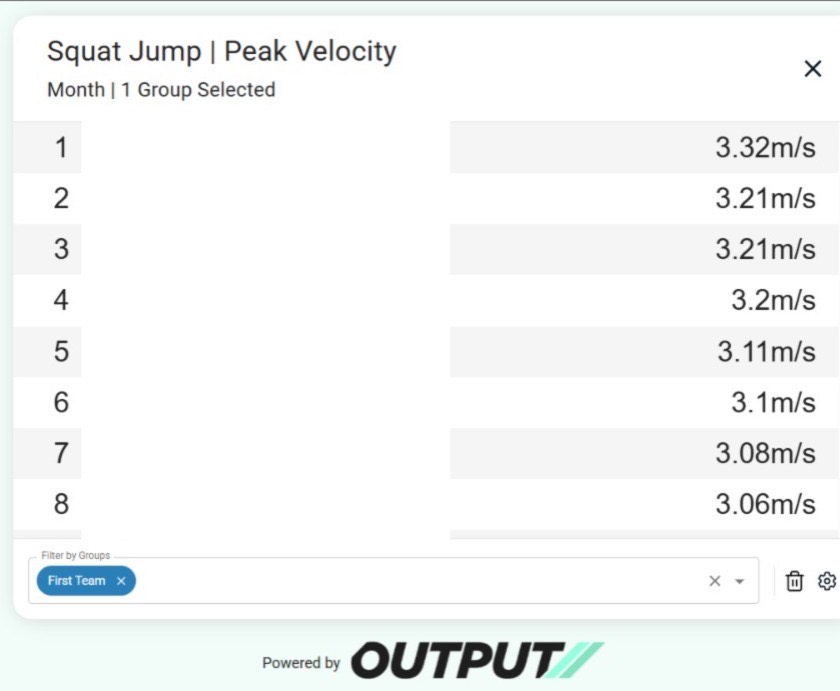
Throughout the season, Output’s dashboard feature has been critical in monitoring fatigue and assessing athletes' physical performance changes. A squat jump exercise was initially brought in as part of power sessions, to drive intent and gamify the exercise, with leaderboards set up in the gym to allow athletes to compete against teammates. That approach allows for continuous profiling as part of gym sessions. However, after looking through athlete and group squat jump data after a couple of months, it was clear that barbell velocity could be a tool for monitoring neuromuscular fatigue in our athletes.
On an individual level, I found barbell velocity data correlated with players who had played a lot of minutes and were potentially in a state of fatigue or overtraining, through significant velocity drop-offs. On the flip side, squad players with lower game minutes showed freshness with continuous increases in barbell velocity over time. On a group level, barbell velocity across the squad correlated with times when fixture congestion was high, coinciding with a reduction in barbell velocity.

This data allowed us to adjust athletes' training prescription in the weight room accordingly, pulling back on unnecessary volume when needed and pushing our athletes when fresh. There isn’t much data on barbell velocity as a tool for monitoring neuromuscular fatigue, but this is an avenue to be researched further.
Another performance question I wanted to answer was simply, “Is my program working?”. Are my athletes able to produce more force after a block of training? This is where barbell velocity came in again. From Newtonian physics, we know that F =ma, that being force is equal to mass times acceleration. If mass is constant (in this case, a 20kg barbell) and we
increase the velocity of movement (Acceleration = change in velocity/change in time), then
we have increased force. By regularly performing barbell squat jumps across a season, we could asses longitudianlly whether the program was workng and force expression was increasing alongside being able to monitor acute bouts of fatigue. This hypothesis of utilizing a barbell squat jump as a performance profile for showing increased force is something I'll research more moving forward, and assess correlation with other “Tests” of lower limb force production, such as the Isometric mid thigh pull (IMTP).

Feedback to athletes and coaches is a key skill in high-performance sport, where the art of coaching comes to the fore. Output Sports dashboard feature allows quick and efficient feedback to athletes and the rest of the multi-disciplinary team (MTD). I send reports to athletes individually to show snapshots of any progress made in Core lifts, squat jump velocity, and any other specific exercises we utilise Output for in their programme. On an MDT level, I show team-wide summaries of velocity data to suggest any interventions that may be made to athletes' weight room programmes based on freshness/fatigue.
Intent is a key driver of adaptation, and in power exercises, the Velocity of movement is the dominant parameter. We use the leaderboard function in our power sessions for loaded jumps to create a competitive environment around the weight room.
Our players are competitive athletes; they want to win, so we tap into that regularly. Linking back to Ben Rosenblatt’s competition structure, this would be a me vs everyone else scenario, the immediate feedback provided by the units also means that we can introduce a me vs me scenario, for example in a rehab session, chasing highest velocities in core lifts or lowest contact time in a plyometric exercise.
As mentioned earlier, our season is long with many fixtures and periods of fixture congestion, so maximising adaptation but limiting excess fatigue is key. Velocity loss has allowed my athletes to chase the desired adaptations without excess fatigue in training/matches.

We'll use a different velocity loss threshold depending on the adaptation we are looking for and the time of the week/season. For example. On our strength day, which is a match day -4 for us, where we are chasing neuromuscular adaptations like motor unit recruitment, etc, we’ll keep velocity loss to 20% on our core lifts. On our power days, which are MD-2’s, closest to a game, we’ll keep velocity loss at 5-10% within our loaded jumps. This keeps the athletes working explosively with no grinding reps or technical breakdown. I usually like
athletes to go 2 reps below the VL threshold, but sometimes, depending on the turnaround between matches, I'll go to 1 rep.


.png)
Monthly performance insights, product updates, and sports science — straight to your inbox.
No spam, ever. Unsubscribe anytime.
No thanks, I'm not interested