

BE THE FIRST TO GET PRODUCT UPDATES
Get notified about new features & special offers......
Load-velocity (L-V) profiling is an excellent way to monitor and profile an athlete’s strength, power and velocity capabilities. An L-V profile is often used to estimate an athlete’s 1 rep max (1RM), compare athletes’ performance characteristics, and personalised exercise prescription - allowing for tailoring training to specific qualities depending on whether you’re focusing on speed, strength and/or power. In this guide we will focus on:

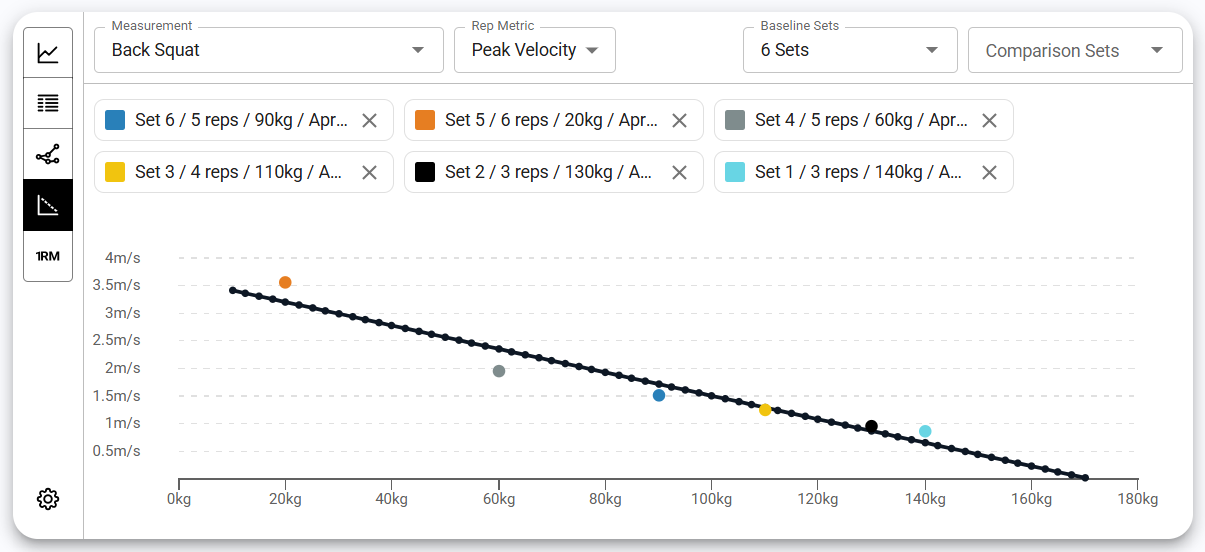
Sample load-velocity profile showing a predominantly linear relationship between load lifted and mean-velocity.
While this article and tutorial video focuses on the relationship between load (kg or lbs) with mean velocity (m/s), you can also view and analyse the relationship between load and the following performance metrics in the Output Hub:
1 // Ensure your athlete has completed a warm-up protocol. It is recommended to use the same warm-up protocol prior to repeat load-profiling sessions for maximal reliability.
2 // Equipment wise, you’ll need a VBT device like Output and a range of weights allowing the athlete to work across their velocity and strength range.
3 // Technically, a quick and dirty load-velocity profile can be completed from 2 sets at different loads at the opposite end of the load-velocity curve e.g. (set 1 @ >1 m/s, set 2 @ < 0.65 m/s). However, for better resolution and accuracy in the profile, the research typically recommends 4-6 sets of increasing load intensity which capture a “spread” of lighter loads (mean velocity > 1 m/s), moderate loads (mean velocity 0.65-1 m/s) and heavy loads (mean velocity < 0.65 m/s) [1]. An example comprehensive data capture protocol is:
2-6 reps @ 20-40% 1RM
2-4 reps @ 40-50% 1RM
1-3 reps @60-70% 1RM
1-2 rep(s) @70-80% 1RM
1 rep @>80% 1RM
The athlete must complete every repetition of every set with their maximal intent (best possible velocity). Utilising the biofeedback from your VBT app during the data capture can encourage this! Whilst load-velocity profiling is not as fatiguing as traditional RM testing, sufficient and consistent rest is recommended between sets to ensure max intent can be achieved. For reliable results try to ensure the athlete uses consistent movement patterns across every set [1,2].
Once you have captured your VBT data across a “spread” of loads, with Output Hub it is very easy to create and view the athlete’s load-velocity profile. Simply,
For those not using an automated method to create a load-velocity profile, the key additional steps are:
The practical applications of load velocity profiling include the ability to make estimations regarding an athlete’s 1RM and max-strength, understand an individual’s athletic performance in comparison to other athlete’s, and provide training specificity.
The load-velocity profile allows you to establish the estimated ‘best-rep’ velocity for a given load in an exercise and vice versa. This can be subsequently used to target specific VBT zones in exercise programming, these are summarised below and in more detail in our guide to VBT, which you can download on this page here.

The force-velocity spectrum in typical S&C exercises [3].
For more detail on programming and prescription with load-velocity profiles and VBT you can check out our guide by Dr. Steve Thompson here. The key is establishing a useful load-velocity profile to start with and then monitor adaptation over time.
The linearly-fitted line in the load-velocity profile may be used to predict an athlete’s 1RM. For this you identify the estimated load at which an athlete’s profile intercepts with an exercise’s minimum velocity threshold. The minimal velocity threshold is unique to each exercise but represents a limit that a full and proper repetition may be completed at in a given exercise (or the velocity of a true 1RM known as V1RM). There are 2 key ways to get a minimum velocity threshold (V1RM0 for an exercise:
Population derived minimum-velocities-thresholds (V1RM): these stem from academic research. They are very useful and efficient to use but it should be noted there is some variance in V1RM from athlete to athlete. In a recent summary paper from leading VBT experts the below values were reported [2]:
Bench-Press: 0.17 m/s
Squat: 0.3 m/s
Deadlift: 0.15 m/s
Overhead press: 0.19m/s
Individualised minimum-velocities-thresholds (V1RM): This is captured by recording a set at any load to true failure and recording the velocity of the final rep. This can be more individualised to the athlete but is time consuming and fatiguing for the athlete which must be considered for practical application.
Once you have the line formula for your athlete’s load-velocity profile you can plugin the V1RM value to estimate the load which represents 1RM.
1RM=(Y_offset-V1RM)/-slope
Plugging in the values from the overhead press demo, we can get the estimated 1RM
We can estimate 1RM for this athlete at:
(1.97-0.19)/0.0193 = 92.25 kg
In addition to using a 1RM estimate as a marker of max-strength over time, the zero-velocity-load or X-Offset will also act as a useful marker of maximal-strength. It may hold a strong relationship to the maximal isometric strength of the athlete in a position similar to the movement they are completing.
At the x-intercept, velocity is 0 m/s so the X-offset can simply be calculated by:
X_Offset = Y_Offset/-slope
Using the data from the demo video this would be:
1.97/0.193 = 102 kg

As aforementioned there are a range of variables which help understand an athlete’s load-velocity profile. In later blogs, we can dive into using these in more detail, but to get started here is how you may compare different athletes under commonly asked questions:
Who is the strongest athlete?
Athletes’ with higher 1RM estimates and X_offset estimates would have better max-strength capabilities. You may also want to consider these variables relative to the athlete’s bodyweight to asses relative strength.
Is an athlete strength dominant or velocity dominant in their power production?
If an athlete has a relatively high y-offset value but low 1RM or x-offset they are likely a velocity dominant athlete when producing their power. Likewise an athlete with a good 1RM but low y-offset may be strength dominant but have poorer force maintenance capabilities at higher velocities. Knowing this can help specify training programmes to address this.
Are my athletes fatigued or fresh today?
The slope of the load-velocity profile is a useful marker of fatigue. If the slope is steeper on a given day it indicates the athlete is slowing down more for every kg or lb added to the load. This can help understand when to reduce the load for a training session. Likewise the max-strength and y-offset variables can sensitive to fatigue and useful to monitor.
Is my athlete improving from their training programme?
The load-velocity profile is great way to show adaptation to training. If an athlete is improving you should see the line ‘shift-upwards’ - that is that their y_intercept will be higher, their slope (velocity decrement per load added) will be less steep, and their estimated max-strength will improve. For highly-trained athletes you may only see certain portions of their profile improve e.g. their velocity production increases at lower loads for a previously max-strength dominant athlete.

.png)
Monthly performance insights, product updates, and sports science — straight to your inbox.
No spam, ever. Unsubscribe anytime.
No thanks, I'm not interested