.jpg)

BE THE FIRST TO GET PRODUCT UPDATES
Get notified about new features & special offers......
Normative data has been one of the most requested features from coaches. From 1 July, test results in Output can be benchmarked the moment they happen, no spreadsheet, no separate report, no waiting on a coach to interpret a number.
"Was that good?" is the question athletes have always asked after a test. What's different now is that Output answers it instantly, on the same screen the result appears on.
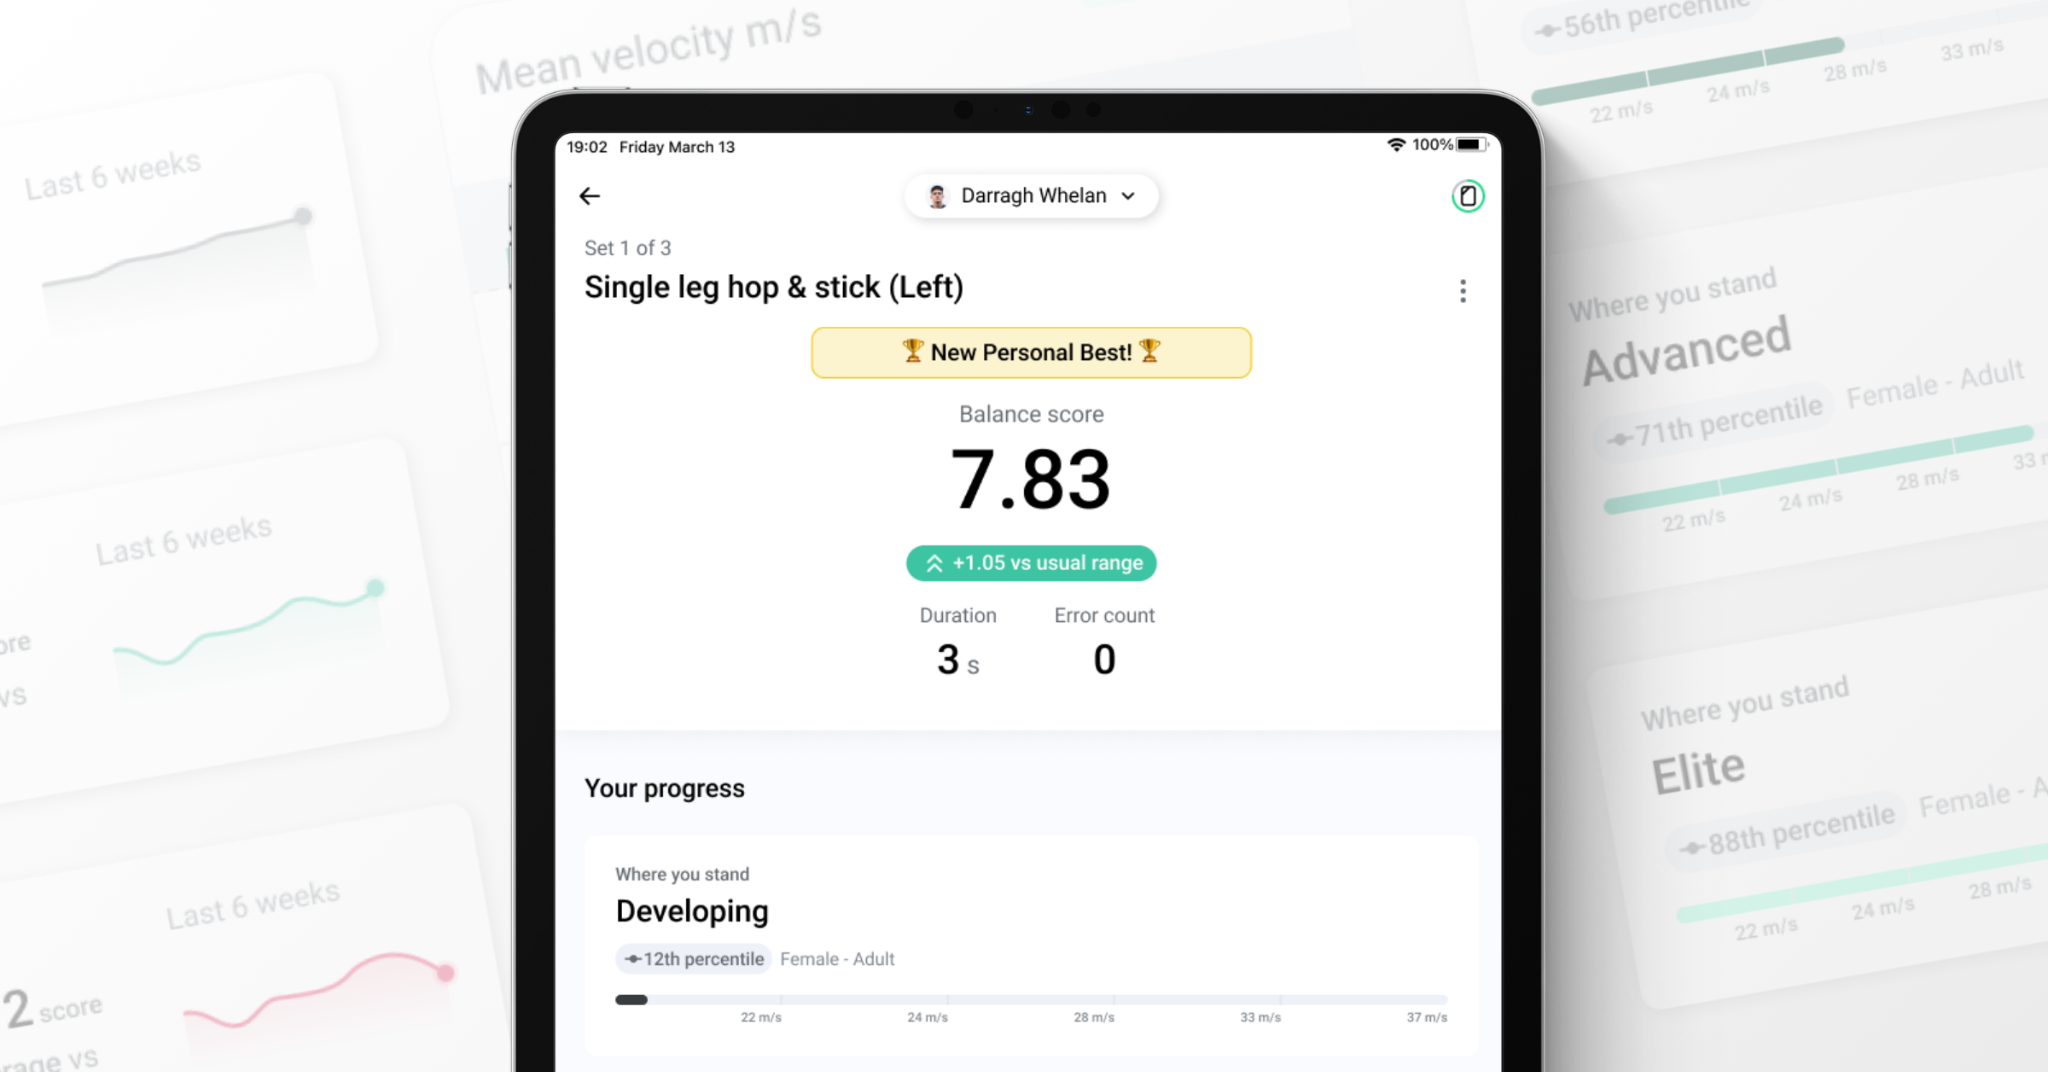
Every Capture set ends with a review screen. It used to show a number. Now it answers what the athlete actually wants to know: was that good, and am I improving?
How it answers depends on what data exists for that athlete.
When an athlete first starts using an exercise in Capture, Output has not yet built their personal baseline. A baseline is created from the athlete’s own repeated test history, and gives coaches and athletes a personalised reference point showing whether a result is above, below or in line with what is normal for that individual.
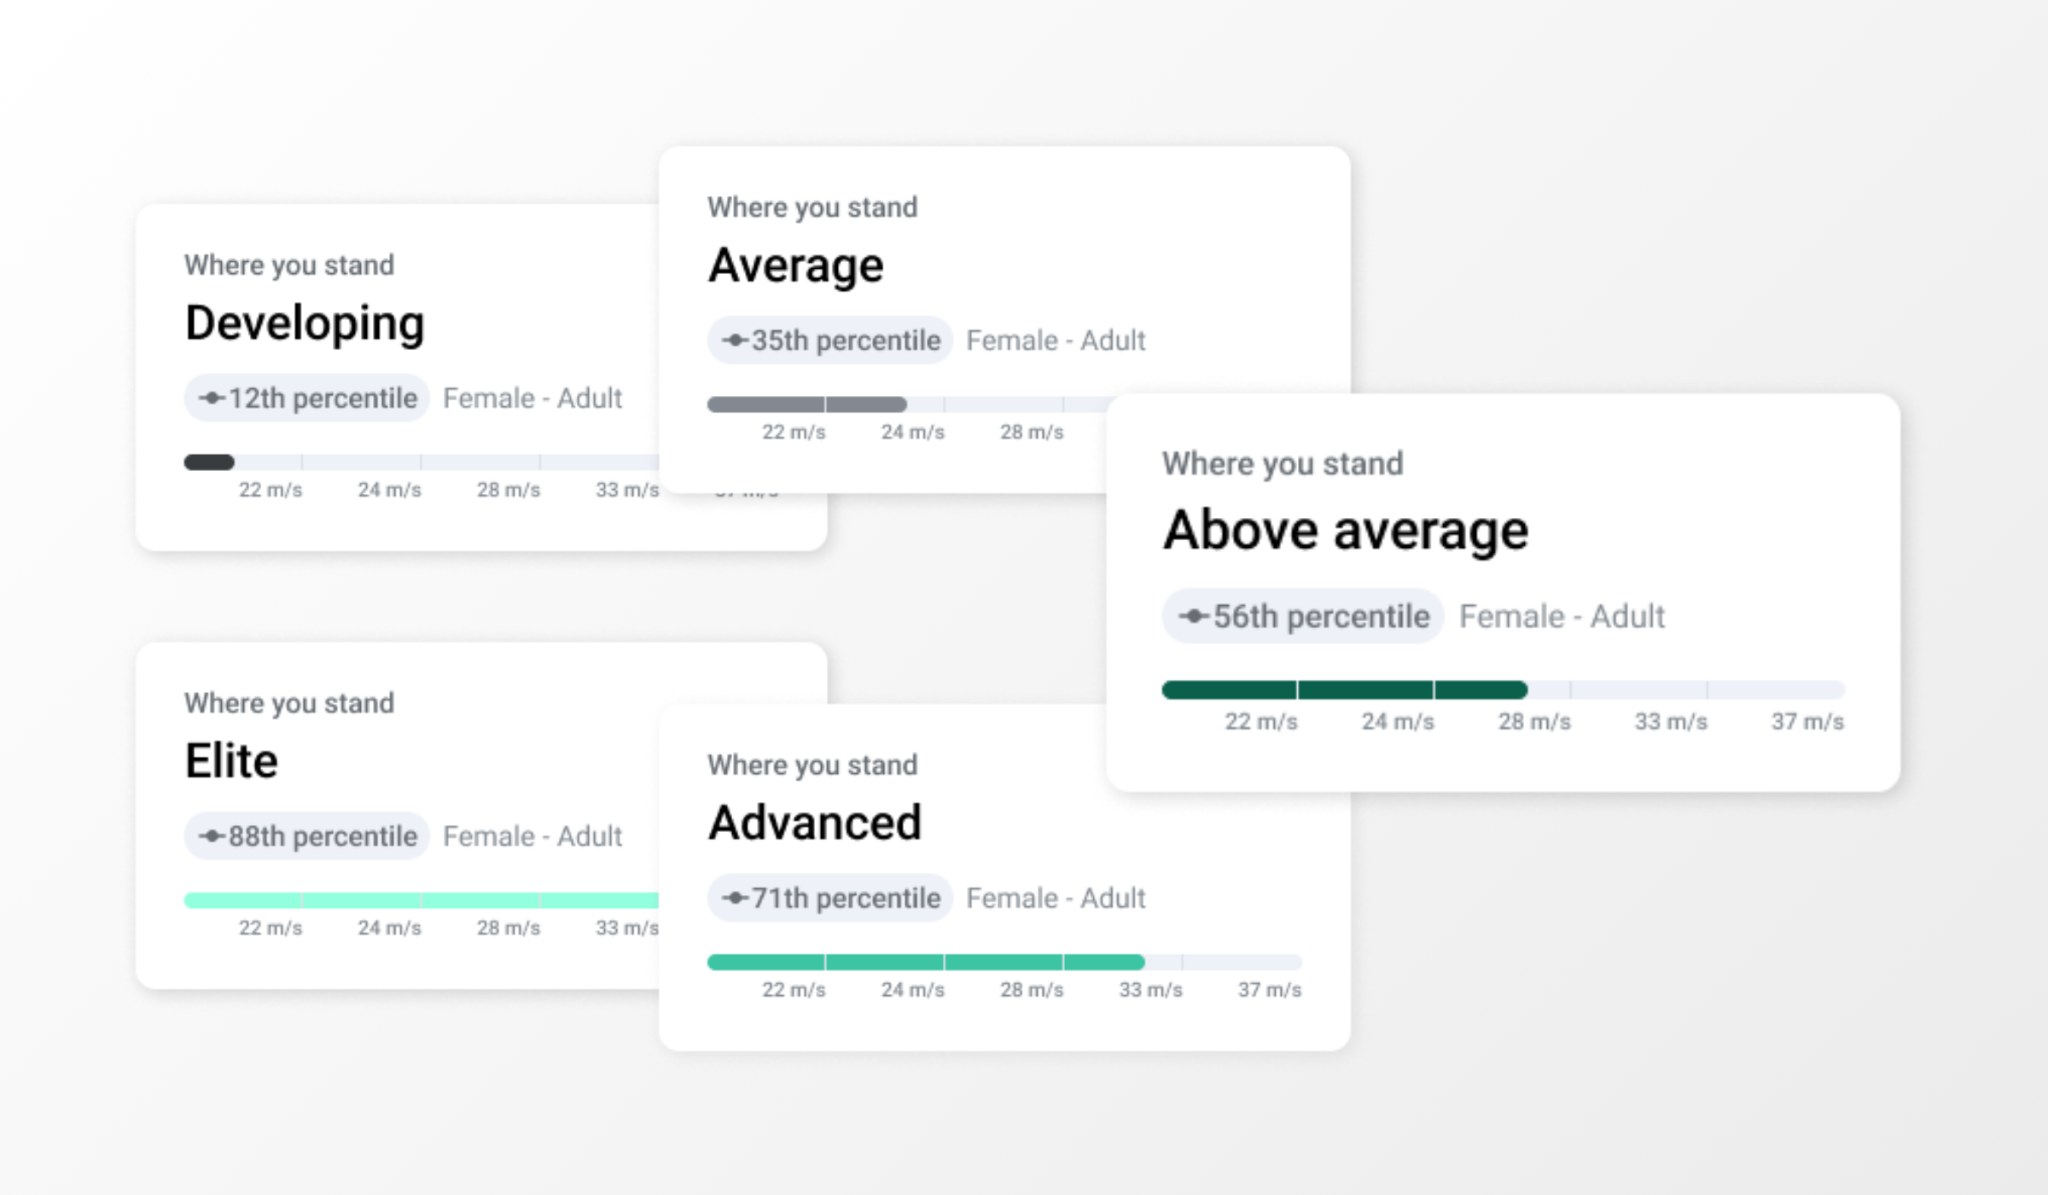
Until that history exists, the post set review screen shows them where they stand relative to the broader Output Sports population instead. On their first test, they will see:
Normative data is only shown for exercises where sufficient population data exists. Coverage currently spans jumps, RSI, mobility and contacts where applicable, and this dataset will be expanded over time, including normative benchmarks broken down by sport.
Book a demo to see how Normative Data could work with your own athletes.
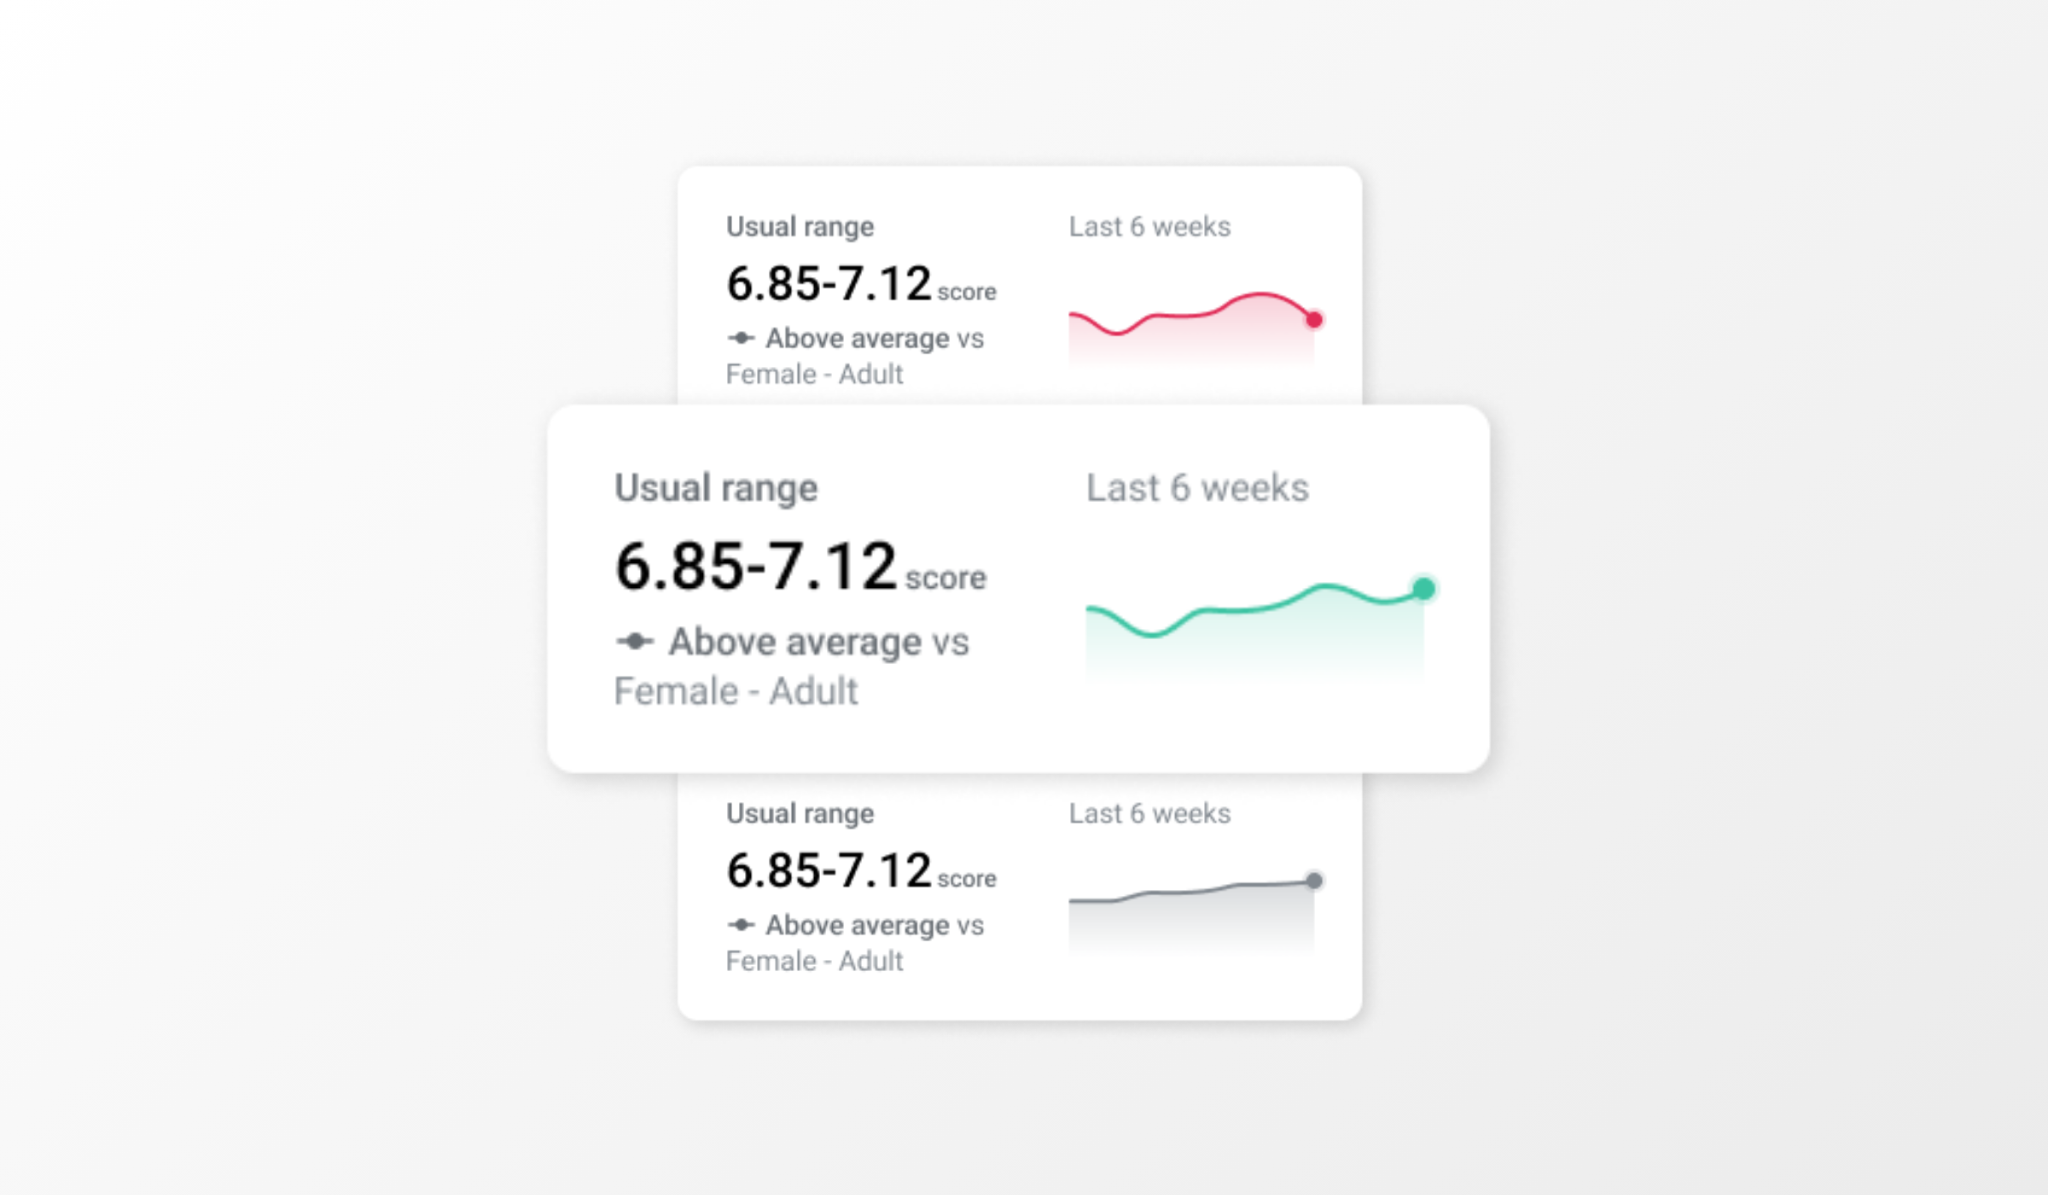
After an athlete has completed an exercise on three distinct calendar days within the last 6 weeks, Output builds their personal baseline. From this point, the review screen switches to showing how they compare against their own usual range, a more meaningful signal for tracking individual progress.
They will see:
Usual range is calculated from rolling six week history using a statistically sound approach that accounts for individual variability, so thresholds are personalised rather than fixed percentages applied to everyone.
Book a demo to see how Baseline Feedback tracks your athletes over time.
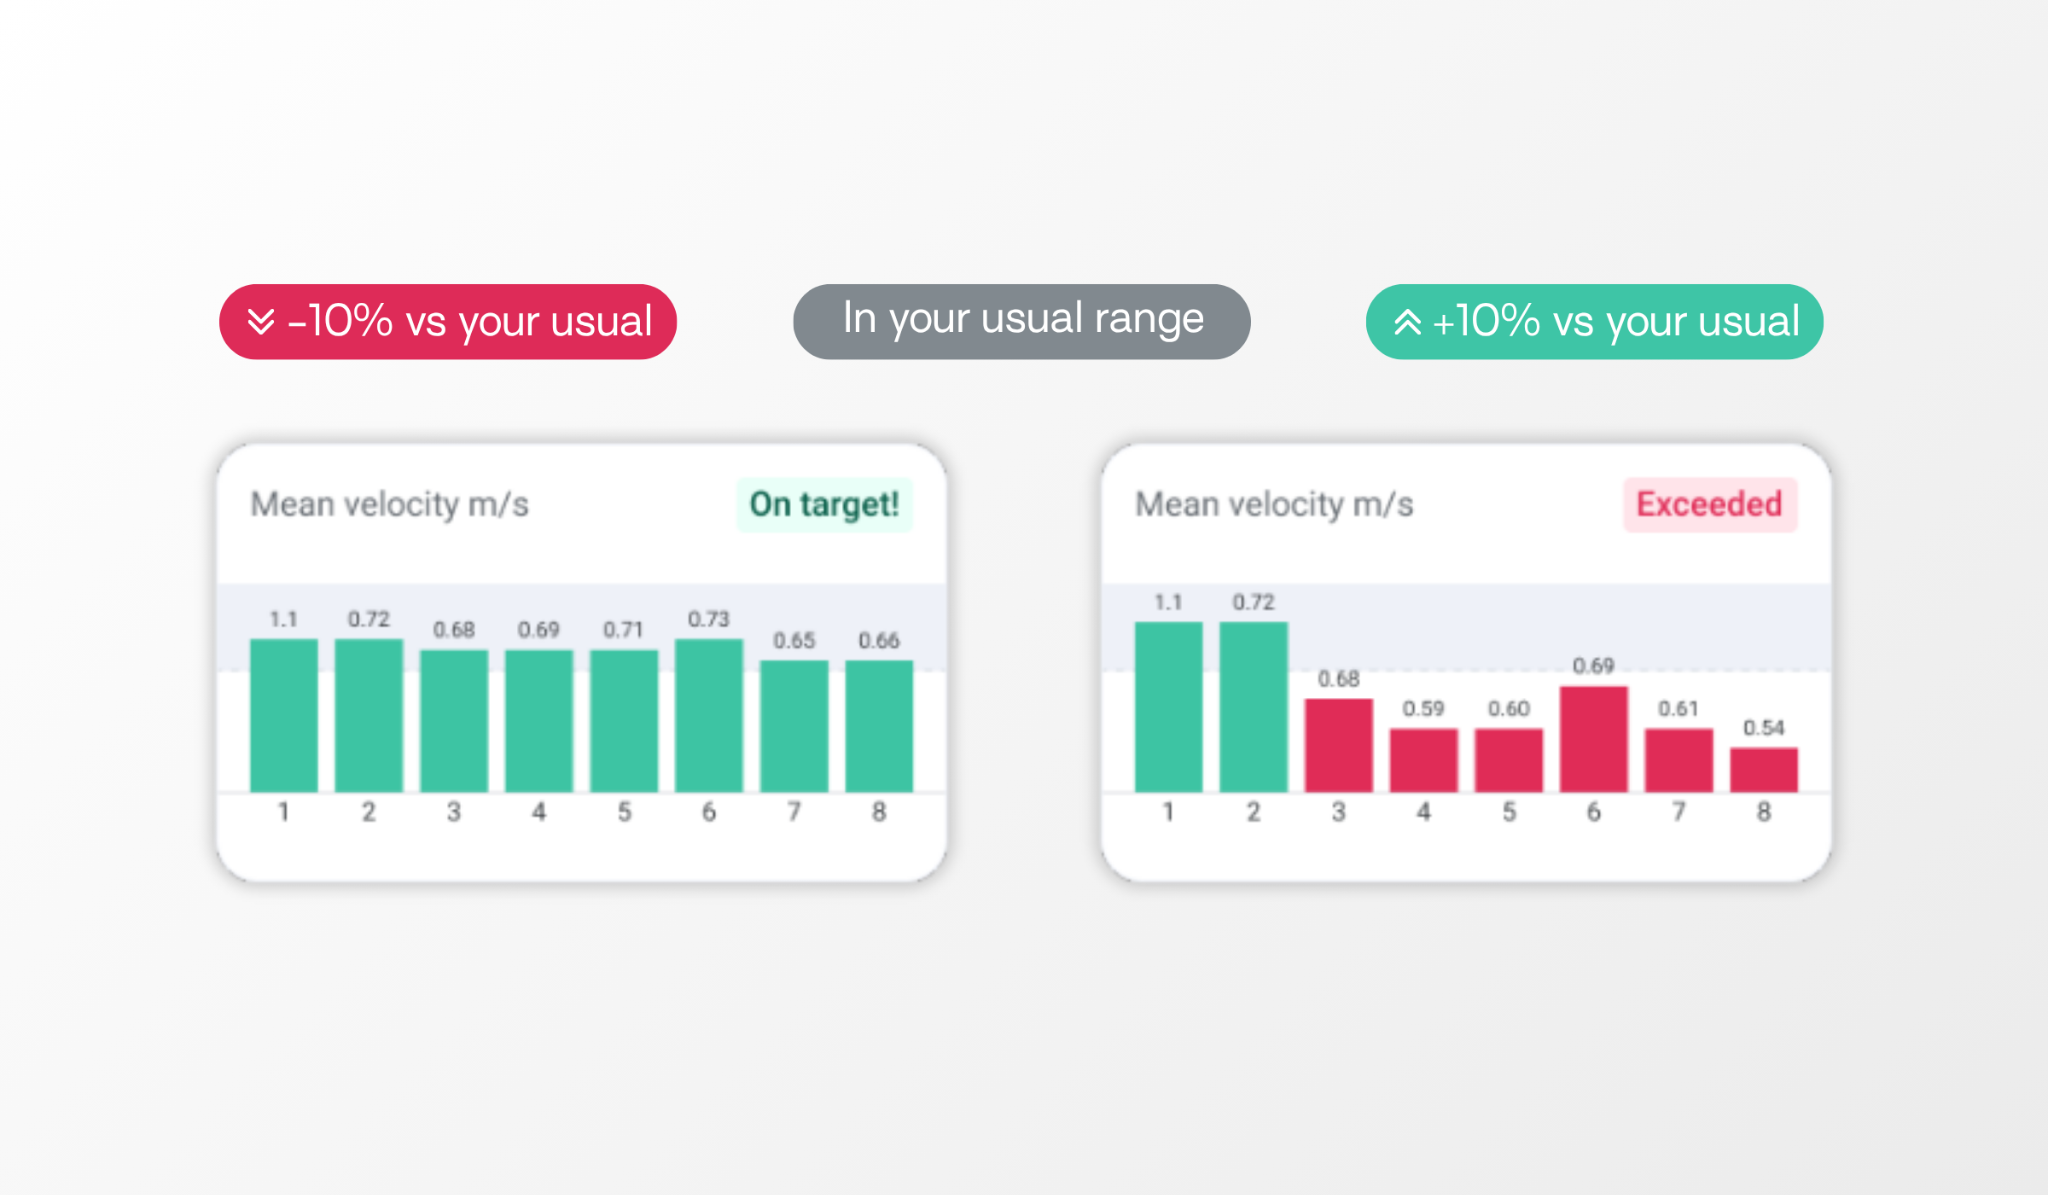
For VBT exercises like the back squat, deadlift and bench press, the review screen separates the coach's target from athlete performance, so it can answer two questions in isolation: was that good, and how am I trending.
If a coach has set a velocity target, that target drives the feedback. For zone targets, they will see one of four outcomes:
For drop off targets, the screen shows which rep triggered the drop off and by how much, on target if the athlete stayed within the threshold, or drop off exceeded with the rep number and actual percentage shown.
Where no target is set, the athlete's Load Velocity Profile takes over as the primary signal, with a baseline widget underneath showing their usual velocity at that weight and whether they are trending up or down.
“Was that good?” is the question every test produces. Until now, answering it meant a coach checking a benchmark table they built themselves, or telling the athlete they would get back to them. Normative Data and Baseline Feedback put that answer on the screen the moment the set ends, whether it is an athlete's first test or their fiftieth.
Book a demo and see it running on your own athletes.
Alongside the review screen update, Hub now supports drag and drop between sessions in the Program Builder. Coaches restructuring a week no longer need to delete an exercise and rebuild it in the new slot. Drag it across, drop it in, and every setting carries with it, sets, reps, weight and velocity zones intact.
It is a small change with an outsized effect on programming speed, particularly during in-season adjustments when a session gets reshuffled at short notice.
For full detail on how the post set review screen works, or on moving exercises in the Program Builder, visit the Output Sports Help Centre or contact support.

.png)
Monthly performance insights, product updates, and sports science — straight to your inbox.
No spam, ever. Unsubscribe anytime.
No thanks, I'm not interested