
BE THE FIRST TO GET PRODUCT UPDATES
Get notified about new features & special offers......


Quick answer: Measure training effectiveness by tracking bar velocity, session RPE, and adherence in every session, then running a controlled test to reassess at the end of a block, when performance drifts, or after a layoff. Training is likely working when bar speed rises at the same load and retest gains exceed the typical error of the test.
Most coaches can show that sessions took place. Fewer can show that the programme worked. Attendance, completed sets, and athlete enjoyment all feel like evidence, but none of them confirm that an athlete is stronger, faster, or more ready to compete than before.
Training effectiveness describes how well a programme produces the change it was designed to produce, and whether that change carries over to the situation that matters. The US Centers for Disease Control and Prevention (CDC), which publishes guidance on evaluating training, frames it as how well training supports learning and learning transfer [1]. The same idea applies in a gym or on a pitch.
The sections below cover how to build testing into training rather than treating it as a separate event, which methods and metrics suit different goals, and how the Kirkpatrick Model gives coaches a structure for evaluating results from athlete feedback through to outcomes.
No single number shows how well trained an athlete is. Two kinds of information are needed, and they answer different questions.
Training load describes what was done and how the athlete responded. External load is the work prescribed and completed, such as load on the bar, sets, and reps. Internal load is the athlete’s psychophysiological response to that work [2]. The same external load can produce very different internal responses between athletes, so tracking only what was lifted misses part of the picture.
Training outcomes describe what changed. These come from testing strength, power, speed, aerobic capacity, and body composition, and they show whether the training worked.
A well-trained athlete shows both: improving results on tests, and a stable relationship between the work done and the response to it.
One condition applies. A test only shows change if its own variation is smaller than the change you are looking for. Sport science uses typical error to describe how much a result varies from one trial to the next [3], so a coach needs to know that figure for each test before reading a small improvement as progress.
Baseline and focused testing. Test before the programme starts under standardised conditions, then repeat the same tests under the same conditions when it is time to reassess. This is the Test stage of the Output Loop: Test, Program, Train, Monitor. Standardised test batteries covering strength, power, speed, mobility, and body composition are set out in NSCA guidance [4]. Strength testing on the Output platform gives a repeatable baseline for key lifts. The platform also includes jump and power testing, speed and explosiveness testing, and movement, mobility and balance testing, so a baseline can span several physical qualities. CDC guidance makes the same point: the best way to evaluate change is to assess before and after training [1].
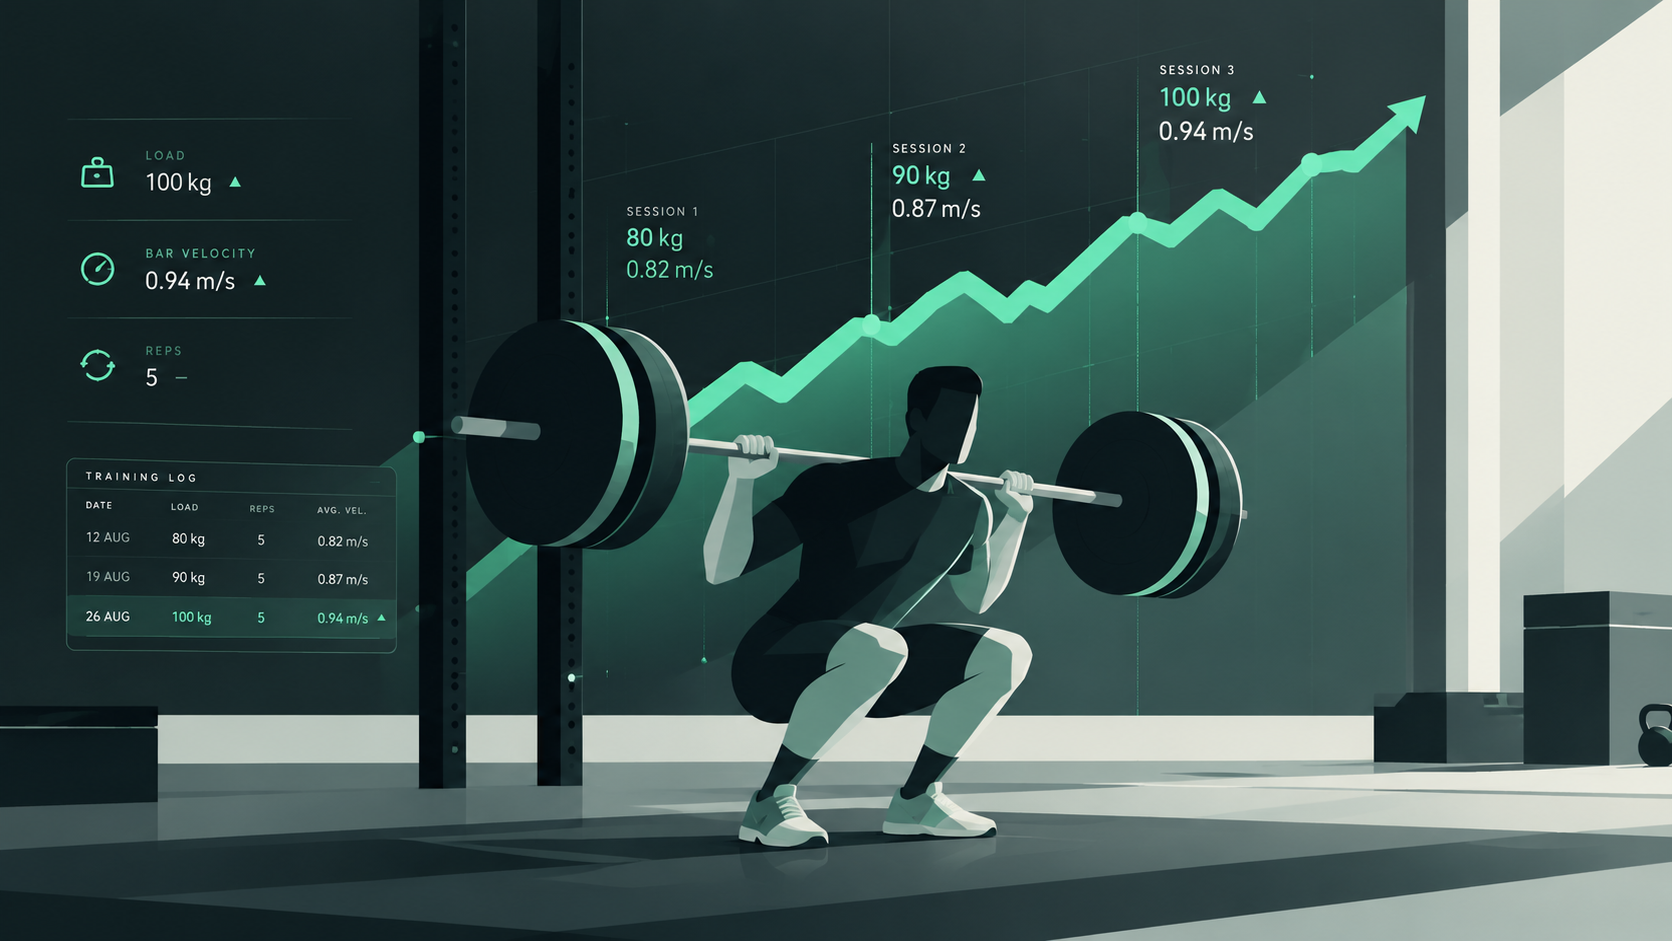
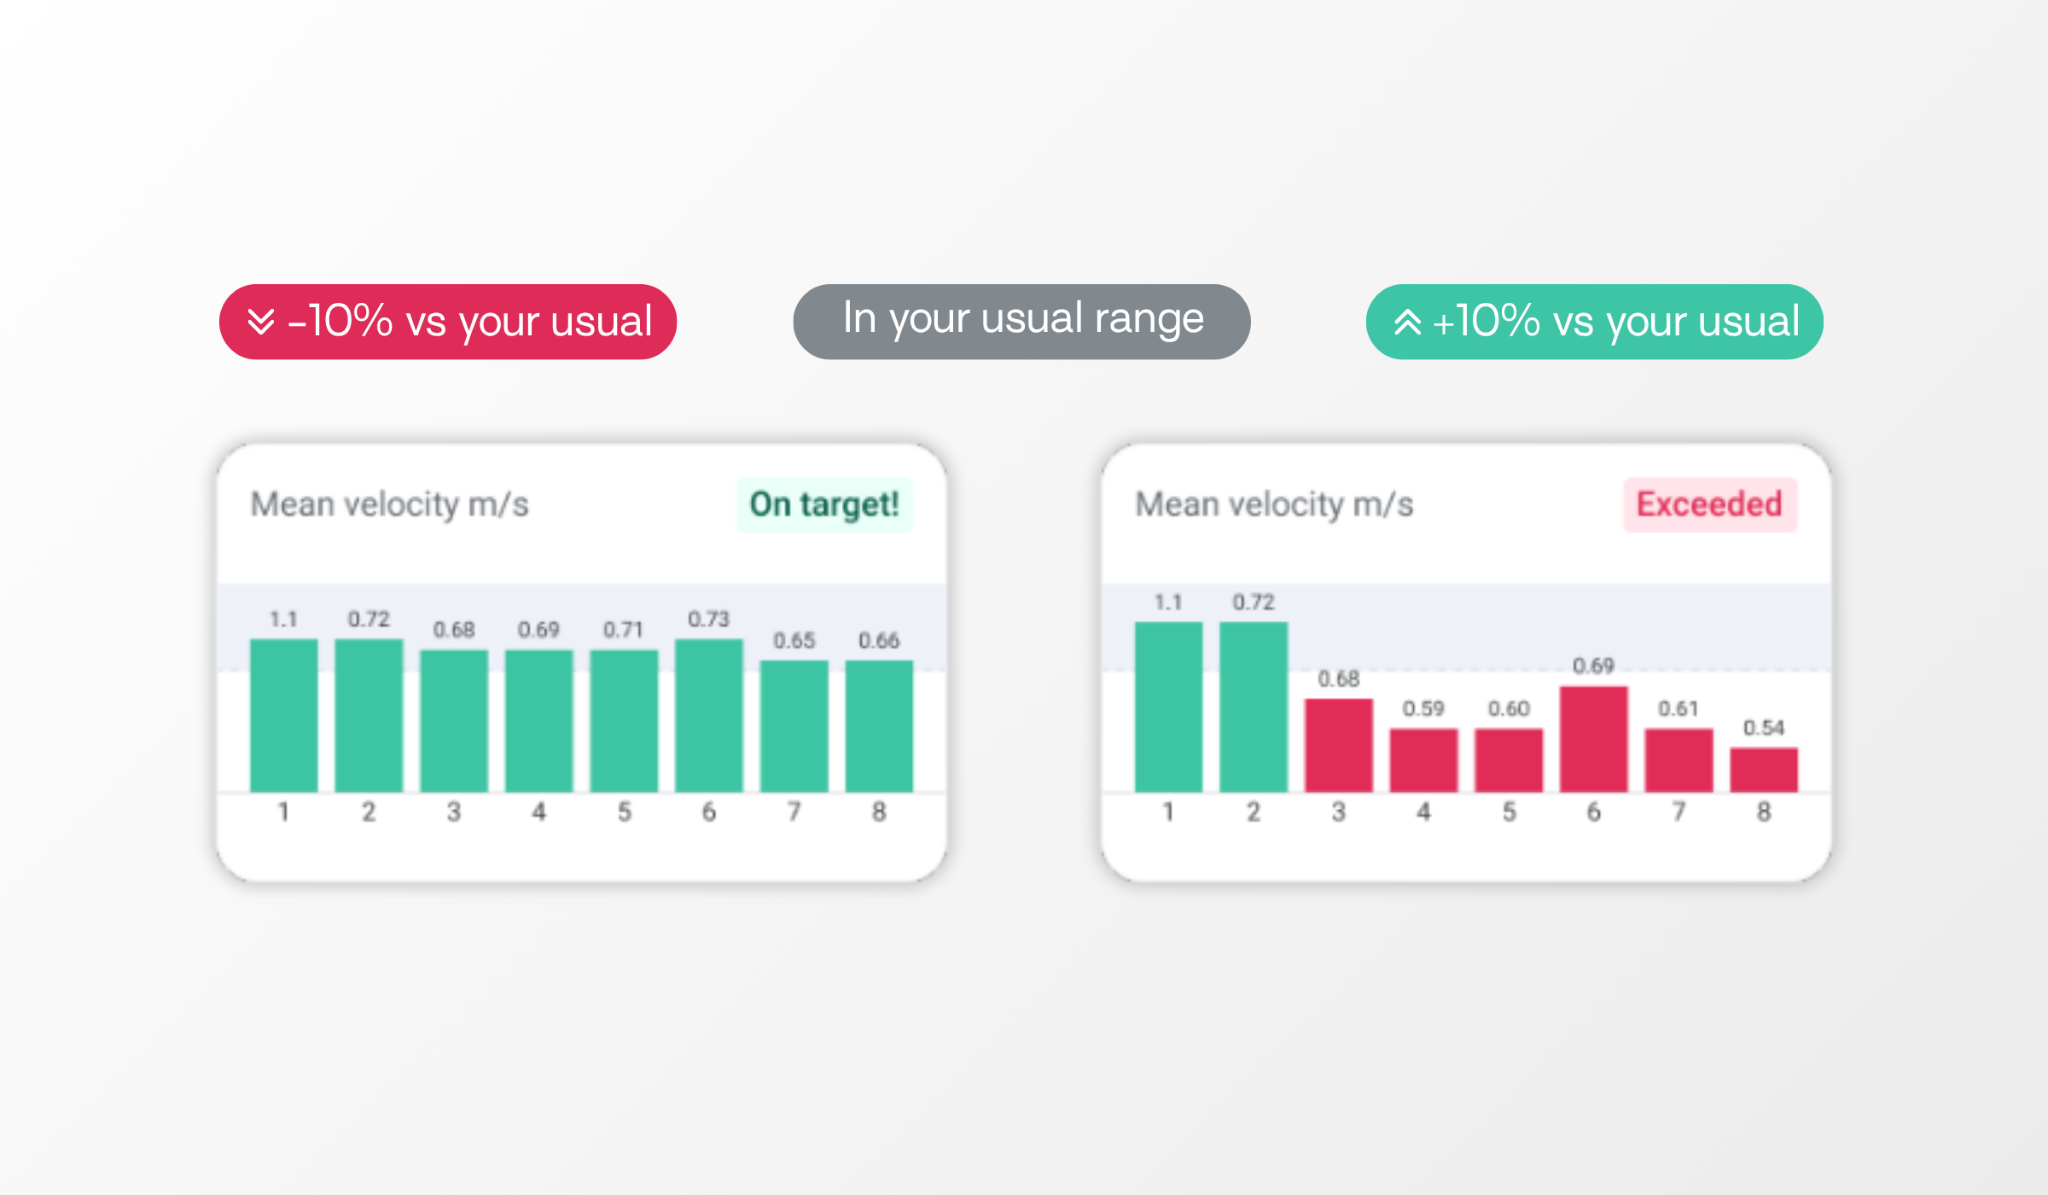
Bar velocity. Velocity gives an objective read on every session. In a study of squat and bench press, velocity loss across sets correlated strongly with blood lactate and, in the squat, with loss in countermovement jump height, which supports its use to quantify neuromuscular fatigue [5]. Applied frameworks use velocity for objective feedback, strength estimation, and load-velocity profiling [6], and a 2025 coach-focused guide covers definitions, load-velocity profiling, and 1RM prediction for S&C practice [7]. Velocity based training turns a training log from a record of what was lifted into a record of how well it was lifted, and faster bar speed at the same load is one practical sign that training is working. For a deeper walkthrough, see the guide to velocity based training.
Session RPE. Session RPE multiplies an effort rating by session duration. It tracked a heart-rate-based method consistently across cycling and basketball, and its authors concluded it is valid across a wide variety of exercise types [8]. A later review supports its use as a stand-alone load monitoring method, though some authors recommend combining it with measures such as heart rate [9]. It is quick, cheap, and easy to repeat.
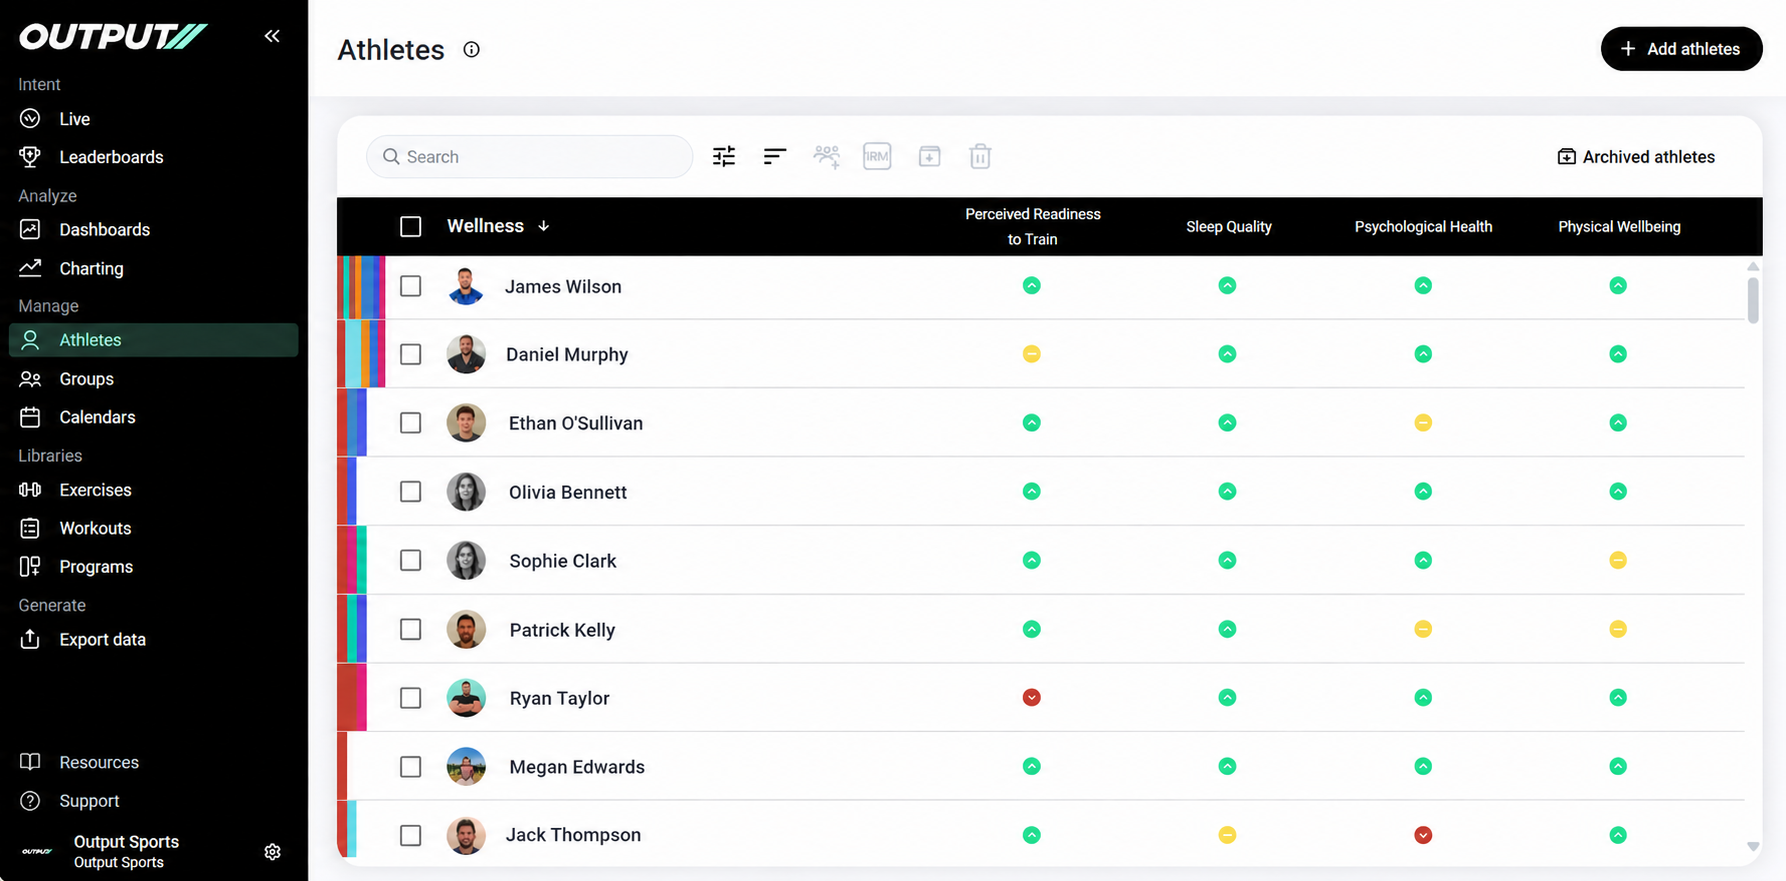
Wellness questionnaire. When internal and external load diverge, the gap may reveal an athlete’s state of fatigue [10]. A short questionnaire covering soreness, mood, and readiness captures the athlete-reported side of that picture. The Output platform includes one in the Monitor stage, alongside the objective testing data.
Adherence and completion rate. A programme that is not delivered cannot be evaluated. Compare sessions completed against sessions planned before drawing conclusions about the programme itself. For a fuller look at what to track and how often, see how to track fitness progress, and for building the programme being measured, see how to create a workout program.
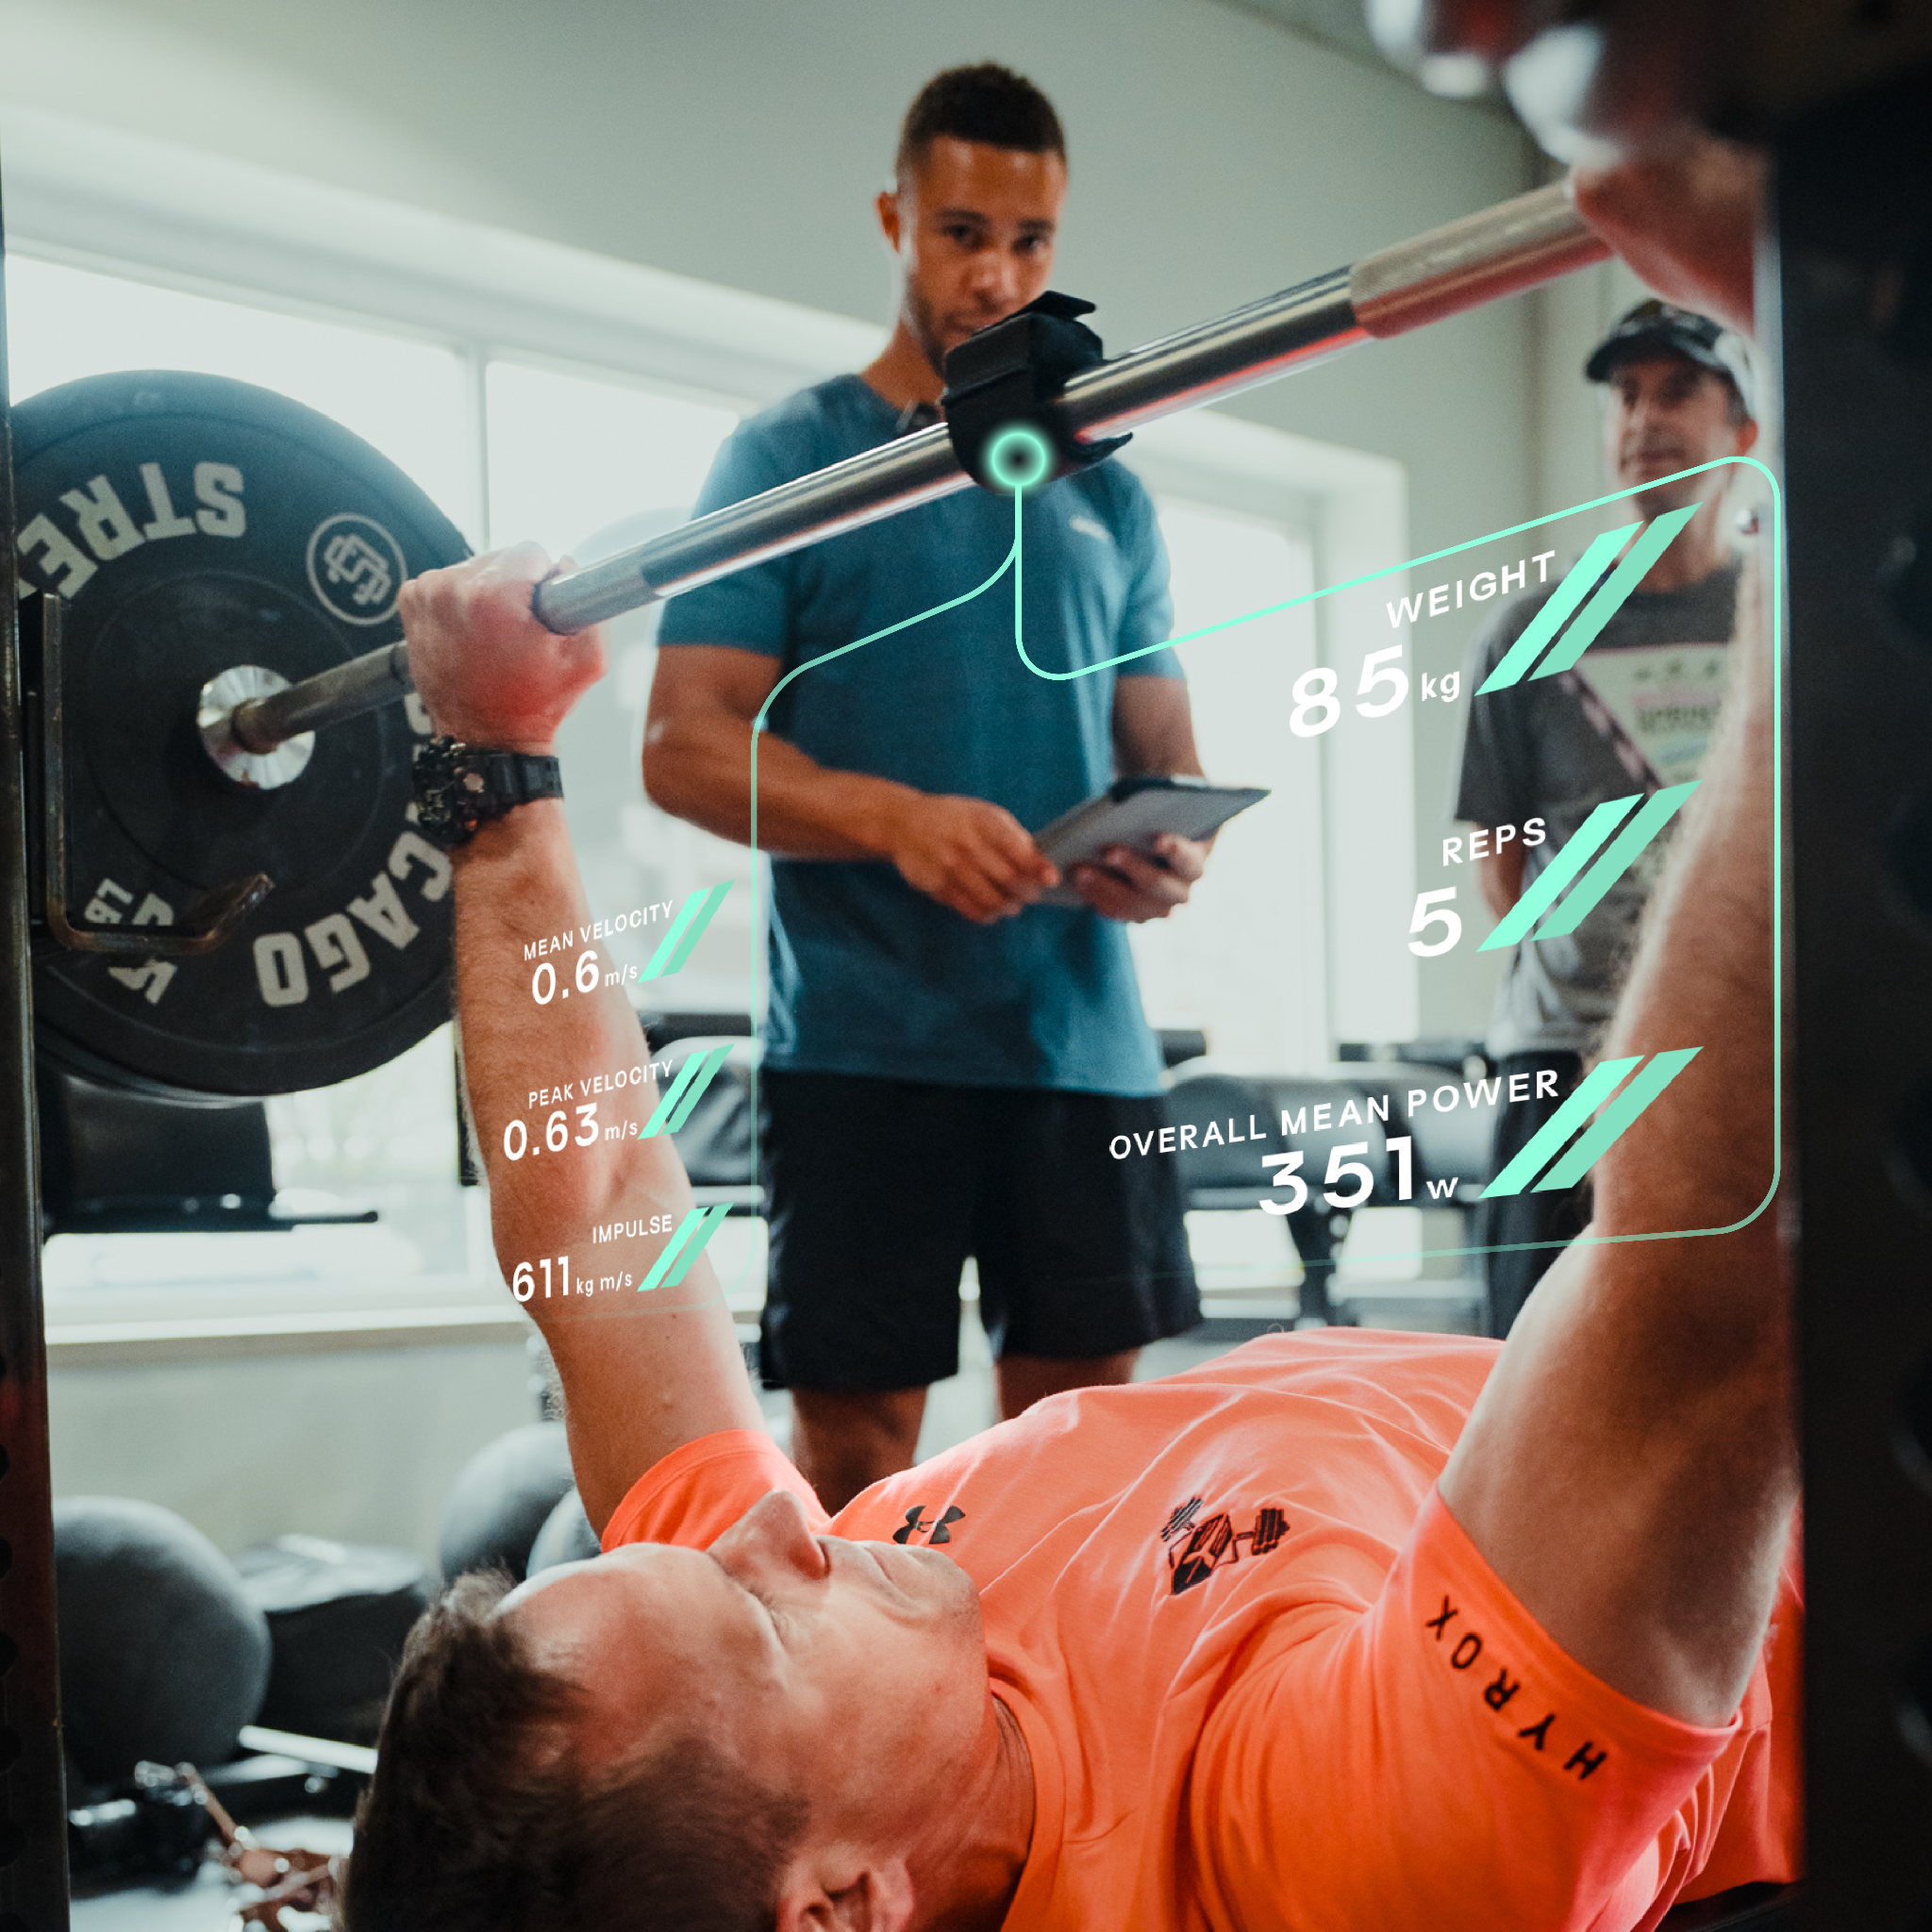
A fixed retest every eight weeks is easy to schedule, but a calendar does not know what is happening to the athlete. A more useful pattern has two layers: testing built into normal sessions, and focused testing under controlled conditions when there is a reason to reassess.
Embedded testing uses the work already being done. Every working set produces data, so bar speed at a fixed load, tracked across sessions, shows whether strength and power are moving without taking a session out of the programme. A standardised warm-up set, a jump before the main lift, or a sub-maximal load used every week works as a quick check. Because it happens inside training, it costs no extra time, which matters most with large squads.
The limit of embedded data is control. Sleep, fatigue, and mood vary from day to day, and training loads are often not heavy enough to build a reliable profile. Read embedded data as a trend and a prompt, not a verdict.
Focused testing is the second layer. It is short, planned, and run under controlled conditions: the same time of day, warm-up, equipment, and technique standard, with the athlete rested. Its job is to reassess and reprofile. For a load-velocity profile, that means including loads above 80% of 1RM, which is what makes the extrapolation reliable.
Run a focused test when one of these happens:
This keeps the Test stage of the Output Loop running through the whole programme rather than sitting at the start of a block. Embedded data tells you when to look more closely, and the focused test tells you what changed.
No single set of metrics suits every programme. Pick measures tied to the goal, and measure them the same way each time.
Treat an estimated 1RM as a ballpark rather than a replacement for testing, and include loads above 80% of 1RM in a load-velocity profile so the extrapolation is reliable. The Output platform captures the profile, but interpreting it remains the coach’s call. For return to play, the most useful comparison is the athlete’s own earlier data where it exists, which is how Output supports rehab and physio settings. For hybrid sports such as HYROX, pair a conditioning test with strength measures, as covered in gym and HYROX training.
Because no single number proves a programme worked, look for several signs moving together:
SimpliFaster’s guide to monitoring the training process explains how session RPE and bar speed at a given load show whether an athlete is tolerating training. If only one sign moves, treat it as a prompt to investigate, not a conclusion.
Not every coach starts with a full system. A practical ladder runs from free to complete measurement, and each rung adds information rather than replacing the last.
The first two rungs use methods covered earlier in this guide, such as session RPE [8], [9] and a wellness questionnaire [10]. The top rung adds objective data that feel-based methods cannot, and the performance hub holds the trends across blocks.
The Kirkpatrick Model was first developed by Donald Kirkpatrick in 1959 and evaluates training at four levels: reaction, learning, behaviour, and results [11]. It comes from workplace training, where the levels give a clear sequence from participant reaction through to business results. Sport has no equivalent tidy formula, because performance is shaped by competition schedule, sleep, nutrition, and the opposition as well as training. What the model does offer is a useful habit: evaluate at more than one level, and do not treat one number as the whole story. The table below adapts it to what S&C coaches can measure.
Reaction is the weakest level on its own. CDC guidance notes that learner satisfaction does not determine whether training is effective [1], so athlete enjoyment is useful feedback but not proof. Anchor the evaluation at level 2 with baseline and focused testing, then use levels 3 and 4 to check the change transfers. The same guidance identifies delayed follow-up as the best way to assess transfer [1], so review test and competition data some weeks after a block ends, not only at the end of it.
Treat the model as a structure for asking questions, not proof of cause. A critical analysis credits it for focusing evaluation on outcomes and for separating learning from the transfer of learning, but also describes it as incomplete and as assuming each level leads causally to the next [12]. In sport, that is a reminder to look for other influences before crediting the programme.
No baseline. Without a starting point, there is nothing to compare against, and any later result is hard to interpret.
Changing tests or conditions. Different equipment, time of day, or testing protocol adds noise on top of the typical error already present in every test [3]. This matters most for focused tests, which only work if they match the baseline. BrianMac Sports Coach lists factors that affect test reliability, including temperature, sleep before testing, and the athlete’s emotional state.
Treating embedded data as a verdict. Session-level numbers move with sleep, fatigue, and mood. Use them to spot a trend, then confirm it with a focused test before changing the programme.
Measuring load but not response. Recording only the work completed ignores how the athlete coped with it, and monitoring both is what makes fatigue visible [10].
Too many metrics. Pick a small set of KPIs tied to the goal of the programme. A few well-chosen measures reviewed often beat a dashboard nobody reads.
Crediting the programme for everything. Competition schedule, sleep, nutrition, and season phase all influence results, so interpret change in context.
Collecting data without reviewing it. Evaluation only improves training when the findings change the next block.
This is the Output Loop in practice: Test, Program, Train, Monitor. Output is a decision-support system for coaches, so the data informs the decision and the coach still makes it. The connected coaching software keeps testing, training, and monitoring data in one workflow, and measurement on the platform is validated against gold-standard methods, so each review rests on data you can trust.
How do you measure training effectiveness?
Test before the programme under controlled conditions, track bar velocity, session RPE, and adherence in every session, and run a focused retest under the same conditions when the data or the calendar calls for it. Compare results against the baseline and the typical error of each test.
How often should you evaluate training effectiveness?
Monitor load and response in every session, and run focused tests when there is a reason to reassess: the end of a block, a drift in bar speed at the same load, or a return from injury or layoff. Follow up some weeks later to check the change has carried over into competition or daily training.
What is the difference between embedded and focused testing?
Embedded testing uses normal training, such as bar speed at a fixed load or a warm-up jump, to track trends at no extra time cost. Focused testing is a short, planned test under controlled conditions, used to reassess and reprofile when the trend or the calendar says it is time.
What metrics show that training is working?
Look for several signs together: faster bar speed at the same load, test gains larger than typical error, steady or lower session RPE for the same session, stable wellness responses, and high adherence. No single metric is enough on its own.
What are the four levels of the Kirkpatrick Model?
The four levels are reaction, learning, behaviour, and results. In strength and conditioning they map to athlete feedback, baseline versus retest results, change applied in training and competition, and outcomes such as match performance or return to play benchmarks.
[1] Centers for Disease Control and Prevention, “Evaluate training: measuring effectiveness,” CDC Training Development. [Online]. Available: https://www.cdc.gov/training-development/php/about/evaluate-training-measuring-effectiveness.html. Accessed: Nov. 5, 2026.
[2] F. M. Impellizzeri, S. M. Marcora, and A. J. Coutts, “Internal and external training load: 15 years on,” International Journal of Sports Physiology and Performance, vol. 14, no. 2, pp. 270-273, 2019. DOI
[3] W. G. Hopkins, “Measures of reliability in sports medicine and science,” Sports Medicine, vol. 30, no. 1, pp. 1-15, 2000. DOI
[4] T. Miller, Ed., NSCA’s Guide to Tests and Assessments. Champaign, IL, USA: Human Kinetics, 2012. Publisher
[5] L. Sánchez-Medina and J. J. González-Badillo, “Velocity loss as an indicator of neuromuscular fatigue during resistance training,” Medicine & Science in Sports & Exercise, vol. 43, no. 9, pp. 1725-1734, 2011. PubMed
[6] J. Weakley, B. Mann, H. Banyard, S. McLaren, T. Scott, and A. Garcia-Ramos, “Velocity-based training: from theory to application,” Strength and Conditioning Journal, vol. 43, no. 2, pp. 31-49, 2021. DOI
[7] S. Thompson, J. Fernandes, H. Dorrell, L. Greig, and C. Bishop, “A coach’s guide to velocity-based training: definitions and diagnostics,” Strength and Conditioning Journal, vol. 47, no. 2, pp. 230-244, 2025. DOI
[8] C. Foster, J. A. Florhaug, J. Franklin, L. Gottschall, L. A. Hrovatin, S. Parker, P. Doleshal, and C. Dodge, “A new approach to monitoring exercise training,” Journal of Strength and Conditioning Research, vol. 15, no. 1, pp. 109-115, 2001. DOI
[9] M. Haddad, G. Stylianides, L. Djaoui, A. Dellal, and K. Chamari, “Session-RPE method for training load monitoring: validity, ecological usefulness, and influencing factors,” Frontiers in Neuroscience, vol. 11, art. 612, 2017. DOI
[10] S. L. Halson, “Monitoring training load to understand fatigue in athletes,” Sports Medicine, vol. 44, suppl. 2, pp. S139-S147, 2014. PubMed
[11] D. L. Kirkpatrick and J. D. Kirkpatrick, Evaluating Training Programs: The Four Levels, 3rd ed. San Francisco, CA, USA: Berrett-Koehler, 2006, ISBN 978-1-57675-348-4.
[12] R. Bates, “A critical analysis of evaluation practice: the Kirkpatrick model and the principle of beneficence,” Evaluation and Program Planning, vol. 27, no. 3, pp. 341-347, 2004. DOI


Monthly performance insights, product updates, and sports science — straight to your inbox.
No spam, ever. Unsubscribe anytime.
No thanks, I'm not interested